Understanding storm surges in the North Sea: Ishiguro’s electronic modelling machine
Abstract
https://dx.doi.org/10.15180/160603/001In December the Science Museum will open Mathematics: The Winton Gallery. The new gallery tells mathematical stories in relation to a broad spectrum of fundamental human concerns. One of the key exhibits is a newly acquired machine for modelling storm surges in the North Sea. Designed by Japanese engineer Shizuo Ishiguro, the object offers a way to explore the far-reaching impact and relevance of mathematical work.
Keywords
History
Understanding storm surges in the North Sea: Ishiguro’s electronic modelling machine
https://dx.doi.org/10.15180/160603/002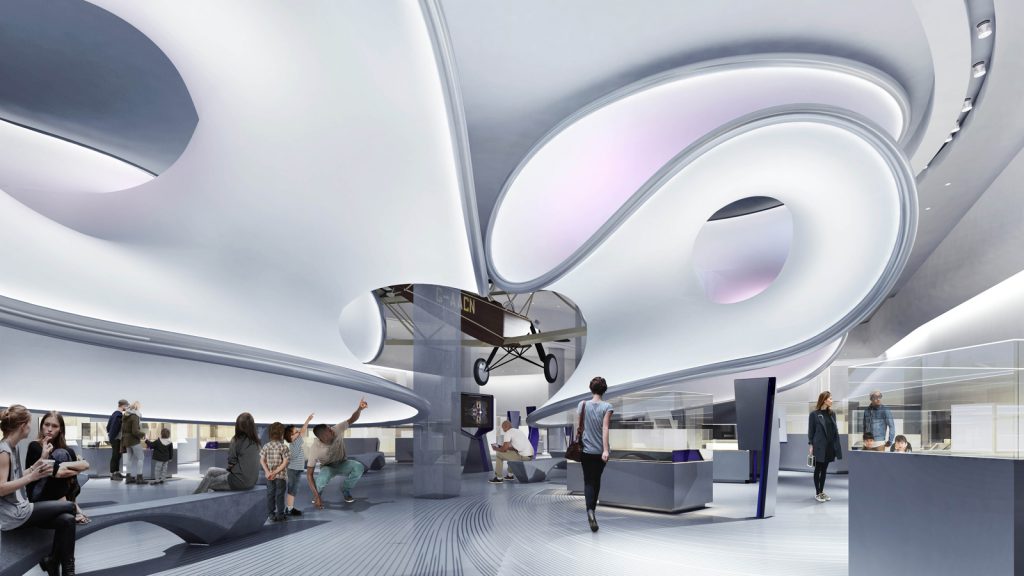
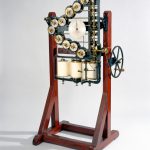
In December the Science Museum will unveil Mathematics: The Winton Gallery (see Figure 1). The gallery, designed by Zaha Hadid Architects, will cover a period of four hundred years, drawing on the Science Museum’s historic collection. Following the principle that mathematical practice has underpinned and been driven by some of our most fundamental human concerns, the gallery aims to inspire and broaden the understanding of what mathematics can be, introducing the people, past and present, who have worked in or with the subject (Rooney et al, 2012). In March 2015 the Science Museum acquired a machine for modelling storm surges into its Oceanography collection (see Figure 2). This new acquisition is a key object for the new mathematics gallery as it encompasses multiple stories that demonstrate the far-reaching impact and relevance of mathematical work.
The storm surge machine sits within the Maps & Models section of the new gallery. This section presents examples of the use of mathematics to understand and control the environment, with stories that cover the survey of the land and mapping of the stars. Following this theme, the new acquisition is concerned with modelling the oceans and was developed to combat the threat of storm surges.
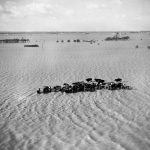
Storm surges are oceanographic events created by strong winds pushing water against a coastline in excess of normal levels (Parker, 2010, p 69). On the evening of the 31 January 1953 a storm surge developed in the North Sea. A period of low atmospheric pressure, with gusts of wind of up to 203 km/h (126 mph), combined with a high spring tide causing the sea level to raise five metres above its usual height (Met Office, 2013). As the storm progressed, the sea level and swell was pushed southwards towards the east coast of England and the Northern European mainland with vast waves hitting East Anglia, the Netherlands, and Belgium.
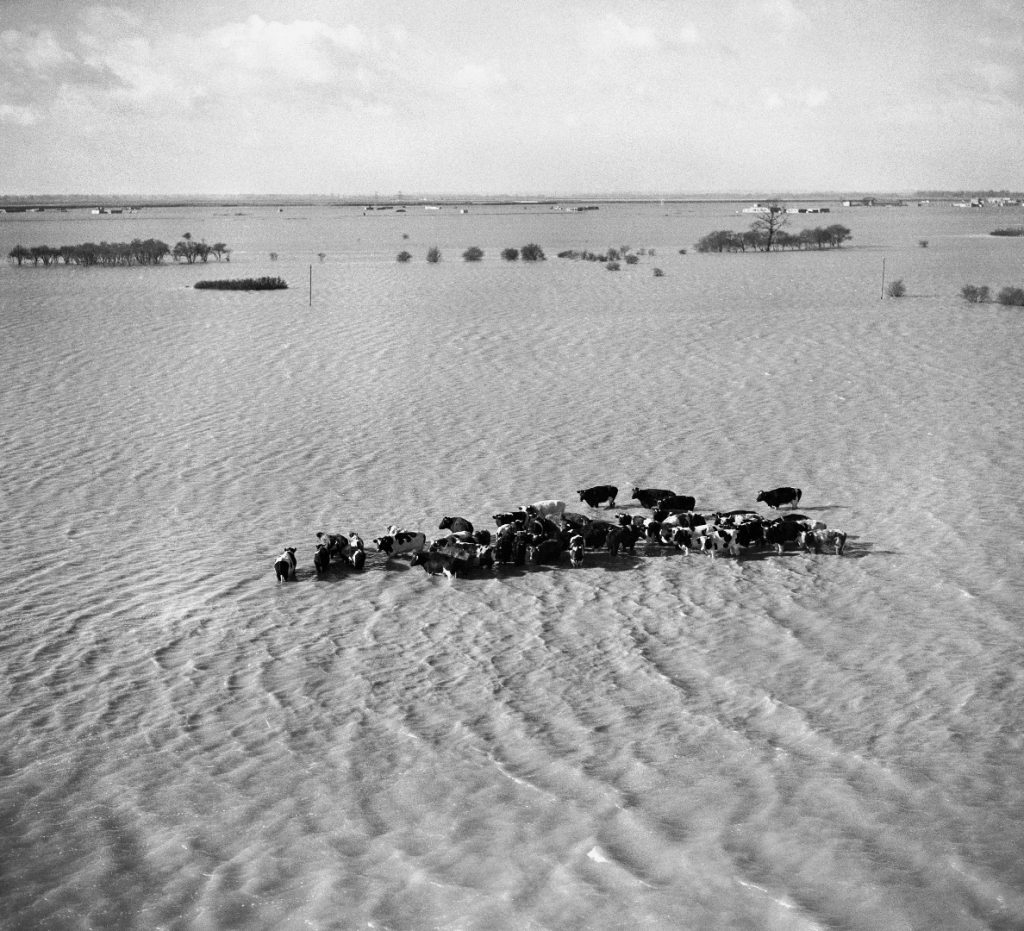
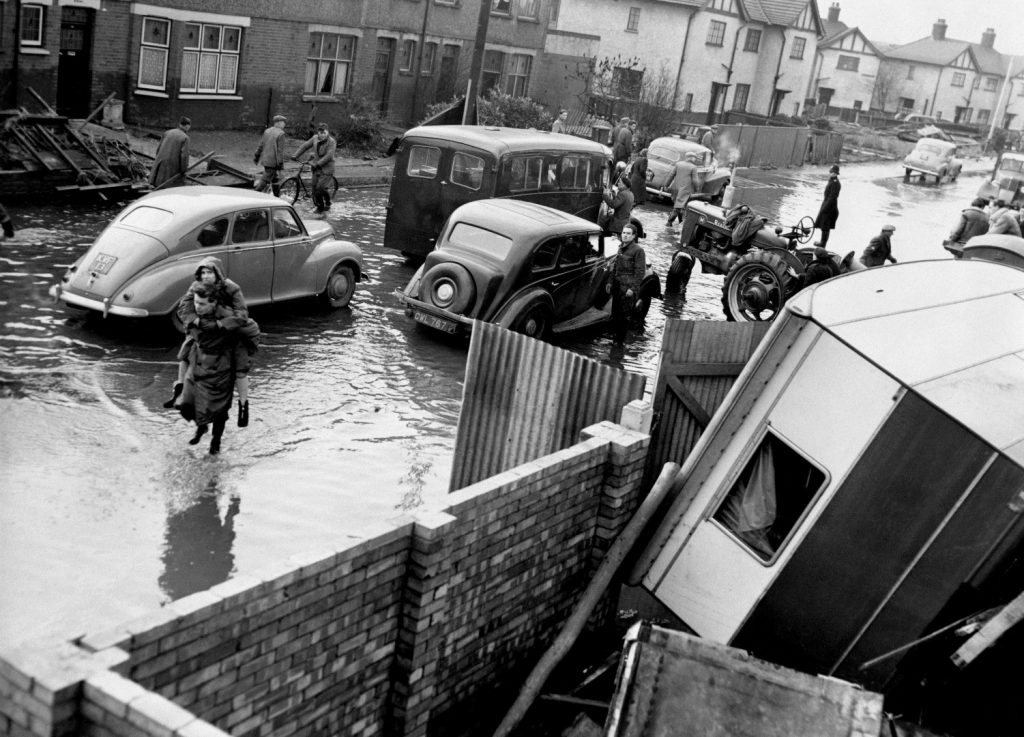
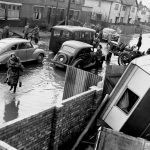
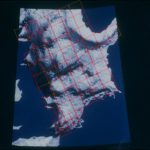
The impact was devastating. The large-scale flooding killed over two thousand people, including 326 in the UK (Met Office, 2013). Ice-cold seawater destroyed thousands of homes, farmland and livestock (see Figures 3 & 4). Over thirty-two thousand people were evacuated from their homes and over fifty million pounds was incurred in reparations (Met Office, 2013).[1] The main problem identified was the lack of warning given to the areas affected. At the time of the flood the study of storm surges was underdeveloped, with oceanographic research focusing on tidal prediction. There was limited data on mean sea level in the North Sea basin due to the lack of a coordinated approach to storm surge prediction which often made warning triggers unreliable (Boon, 2004, p 147). In addition, there had been no effective system to signal impending impact along the coast of the UK and the message was slow to travel across the British Isles, exacerbated by the fact that the storm hit at night on the weekend (Baxter, 2015, p 1295). Furthermore, there were inadequate preventive barriers in place along vulnerable areas of the British coastline, in many cases as a consequence of wartime breaches (Baxter, 2015, p 1307).
The 1953 North Sea flood is considered to be the worst natural disaster in British history (Parker, 2010, p 82–83). The damage prompted a governmental review into flood risk, establishing the Department Committee on Coastal Flooding (known as the Waverley Committee) in order to develop a research plan to prevent future disasters (Parker, 2010, p 82–83). In 1954 the Storm Tide Warning System and Tidal Gauge Network were established, a first step toward creating a warning system to track changes in mean sea level across the British coastline (Smith and Ward, 1998, p 285). This network also provided a way to collect regular, uniform data from which long-term predictions could be developed.
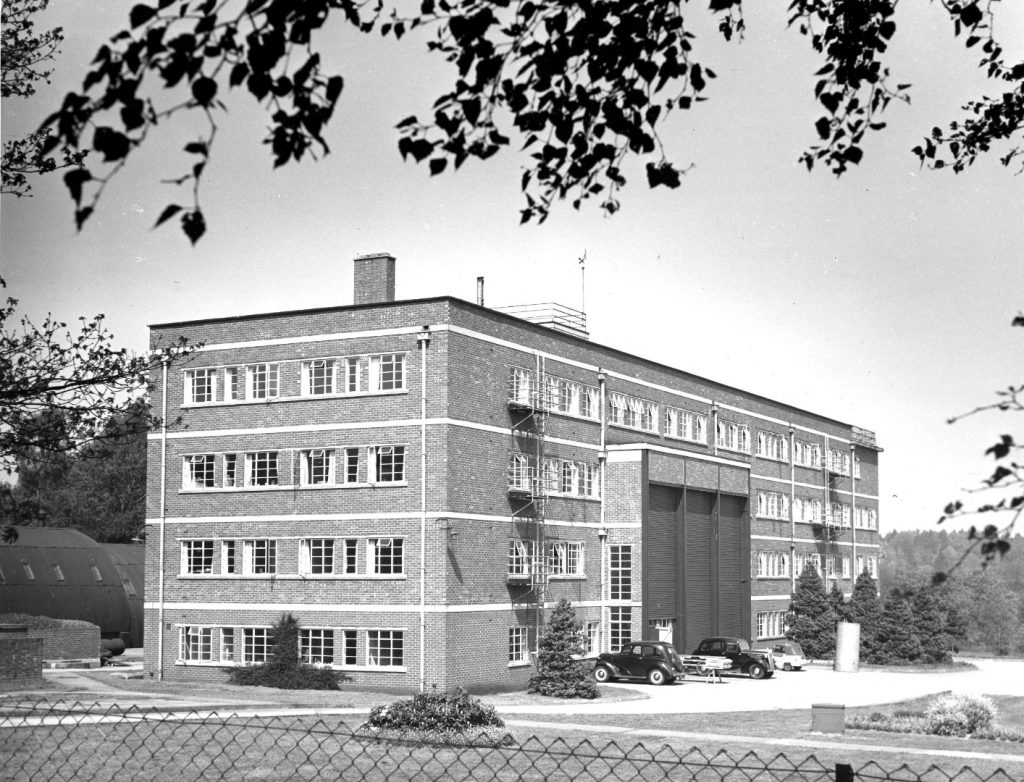
The National Institute of Oceanography (NIO) in Wormley, now the National Oceanography Centre (NOC)[2], had been created in 1949 to bring together mathematicians, oceanographers, physicists and engineers for a wide range of oceanographic work (see Figure 5) (Laughton, 2010, p 78). The organisation grew out of Second World War research, where careful calculation of tidal movements was vital for naval operations. George Deacon, the first Director of the NIO, and his team contributed to the success of the D-Day landings and developed systems that aided deep ocean navigation (Laughton, 2010). After the 1953 floods the government promptly increased support for storm surge research at the NIO, backing a shift away from tide prediction and toward forecasting oceanographic events, with an emphasis on an integrated approach, incorporating physical modelling and mathematical computation (Carlsson-Hyslop, 2010, p 277).[3]
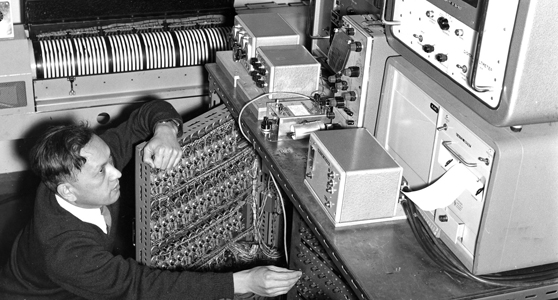
Following the new government directive, the NIO began to look overseas for new insights in storm surge modelling. In 1956 Deacon travelled to Japan to attend a conference on tsunami modelling, where he encountered Shizuo Ishiguro presenting a paper on his electronic analogue system for measuring the coastal impact of surges (see Figure 6) (Cartwright, 2011).
Ishiguro was a trained electrical engineer and meteorologist and had begun developing a system for storm surge prediction during his time working at the Marine Observatory in Nagasaki. There he was tasked with the development of a system that could aid the fishing industry through the prediction of ocean events (Erosion Board Office, 1953). In 1957, following their initial introduction, Ishiguro took up a UNESCO fellowship to work with Deacon at the NIO in order to develop his work further (Cartwright, 2011).[4] In 1959, after working in the UK for two years, Ishiguro joined the NIO on a permanent basis as an oceanography engineer (Cartwright, 1999, p 183).[5] In this role he was able to develop his machine for modelling storm surges with application to the North Sea basin.
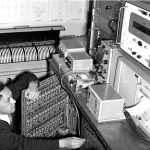
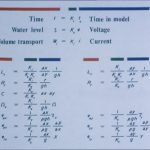
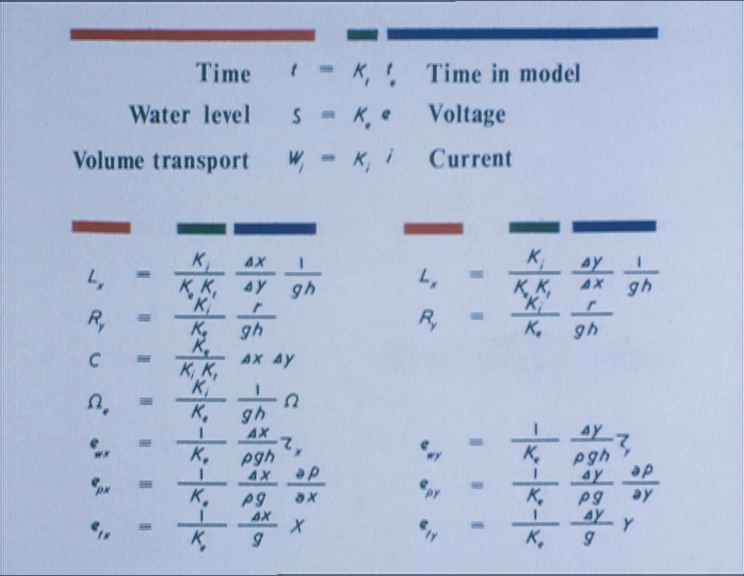
Ishiguro’s machine converted hydrographic and meteorological data into electronic quantities, such as voltage and current, in order to model storm surges and other long-wave phenomena.
Using knowledge of the area under investigation, the machine simulated how a surge might behave and consequently its effects on a coastline and surrounding area. It produced output data as real-time electronic quantities through an oscilloscope or as photographic records of wave responses. Ishiguro built the machine in order to work out when surges will occur, where they will make coastal impact, how high the surges will be at different locations, and why they occur from an ‘academic point of view’ (Ishiguro, 1968).
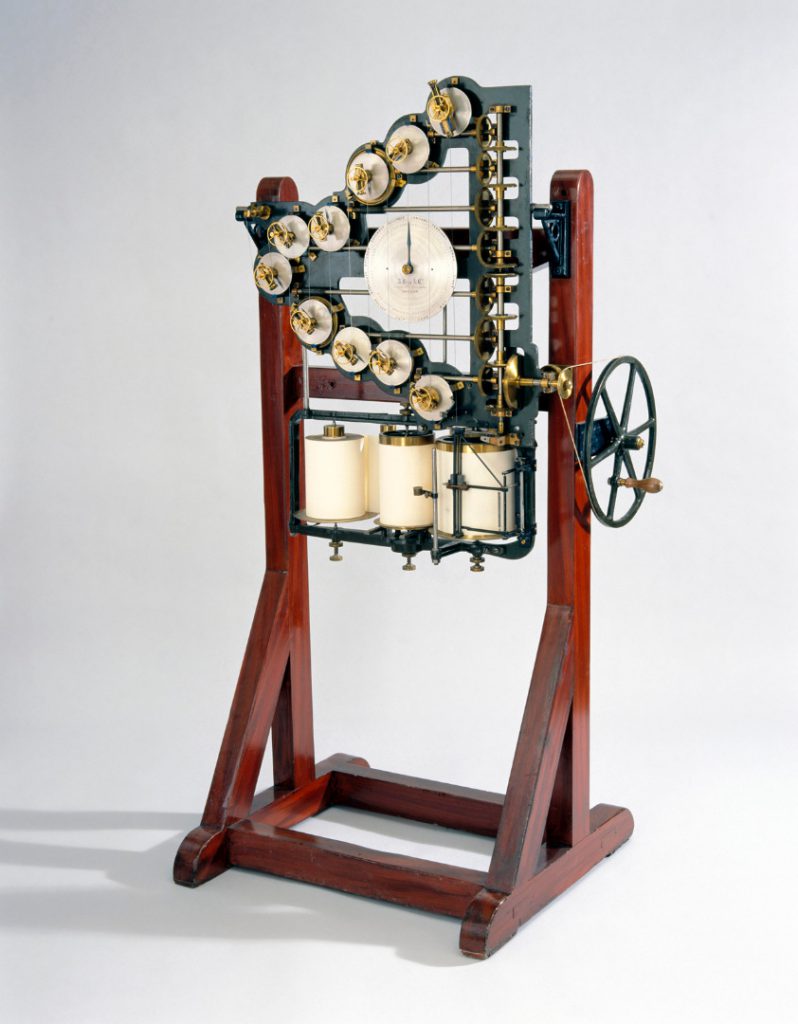
Although developed in response to a specific natural disaster in British history, Ishiguro’s machine is part of continuing mathematical and engineering attempts to provide accurate surge and tidal prediction. Mathematics has been used to understand the oceans since antiquity but it was in the eighteenth century that hydrodynamics – the study of the movement of fluids – was formally developed with the application of calculus (Darrigol, 2005, pp 3–5). In the nineteenth century further progress was made with harmonic analysis, Lord Kelvin’s (William Thomson) mathematical technique to measure waves and currents (Parker, 2010, p 34–39). Kelvin realised that tides could be broken down into waves of distinct oscillation, extracted from observations as tidal constituents (Boon, 2004, p 46). Harmonic analysis enabled estimates to be made regarding amplitude and phase for a set of tidal constituents at specific locations of coastline, forming a prediction of the tidal movements (Boon, 2004, p 93). The Science Museum collection holds Lord Kelvin’s tide-predicting machine from 1876 (see Figure 8), which was able to calculate a year’s worth of tidal movements using the harmonic method of analysis, as well as Kelvin’s harmonic analyser for tidal computations from 1878 (INV. 1896-60) which solved partial differential equations to inform hydrodynamic research. Alongside their calculation ability, these machines relied on the collection of accurate data through tidal staffs and weather gauges (Parker, 2010, p 35).
Ishiguro’s machine continues this tradition of mechanical analysis of the oceans but with specific application to storm surges, a more complex oceanographic event due to its incorporation of meteorological elements as well as hydrographic variables. The strength of a surge impact is influenced by many elements including the shape of a sea basin, wind strength, the coastal topography and the bathymetry (sea floor topography and depth) of the affected area (Smith and Ward, 1998, p 152). As such storm surge models need to allow for altering water depths and changing boundary conditions in order to meaningfully recreate the movement of a storm through an area of water. As a result of this need to incorporate flexibility and movement within a set period of observation, storm surge modelling lends itself more readily to physical modelling (Smith and Ward, 1998, p 284). At the time of the machine’s inception, in the 1950s, electronic computing became a popular tool for this type of modelling due to the ability to calculate complex differential equations at high speed, whilst also incorporating changing parameters and presenting results in real-time (Bissell and Dillon, 2012, p 108).
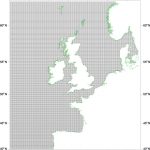
To perform a simulation using the machine, parameters are set that conform to the body of water and conditions under investigation – in this case the North Sea. The shape of the North Sea basin makes it particularly vulnerable to storm surges due to the funnel-like movement of water toward the Northern European coast, making the accurate inclusion of its physical conditions important for effective modelling of events. Throughout the machine’s life-span, Ishiguro’s research benefitted from increased accuracy of this data via technological improvements in data collection, with ship borne wave recorders put into action from 1974 onwards and precision depth recorders and sonar technologies gathering more accurate bathymetry measurements in the second half of the twentieth century (Walker, 2012, p 324). The machine can incorporate conditions for water depth, wind level, Coriolis effect (force relating to the Earth’s rotation), and atmospheric pressure over a specific period of time through voltage generators (Ishiguro, 1968). Furthermore, inertia and bottom friction can be represented by inductors and resistors (Ishiguro, 1968).
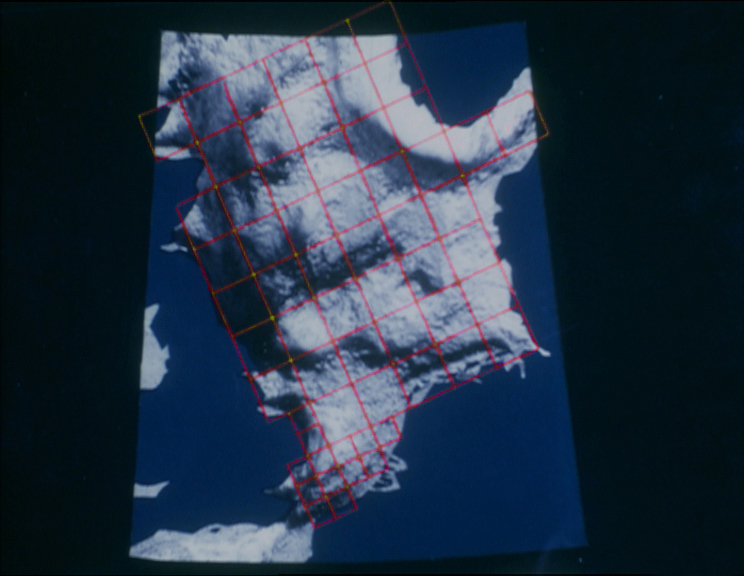
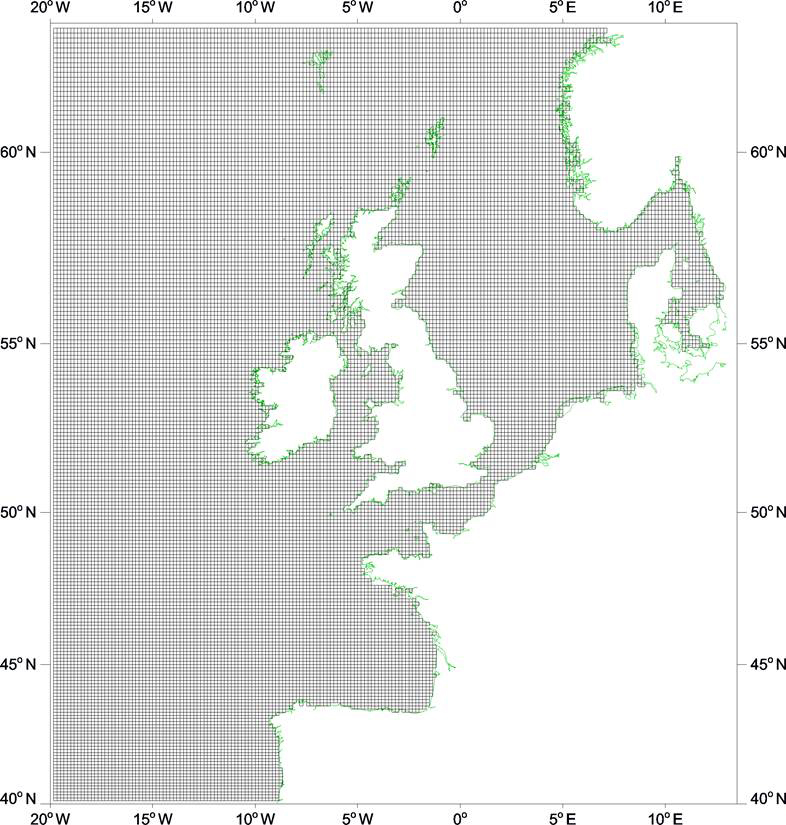
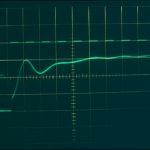
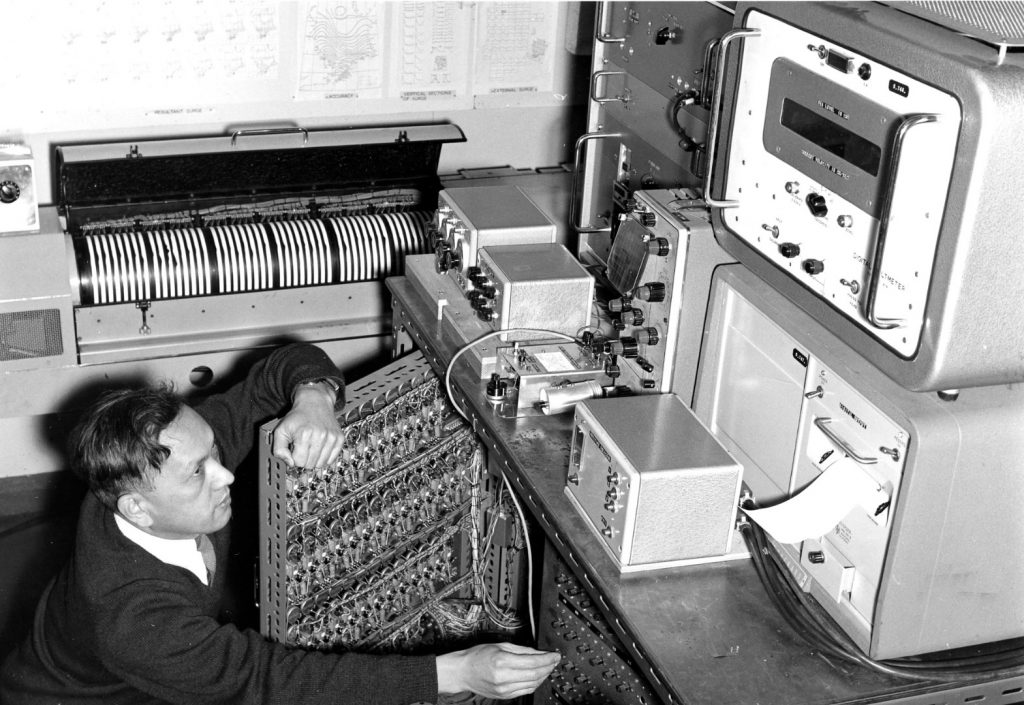
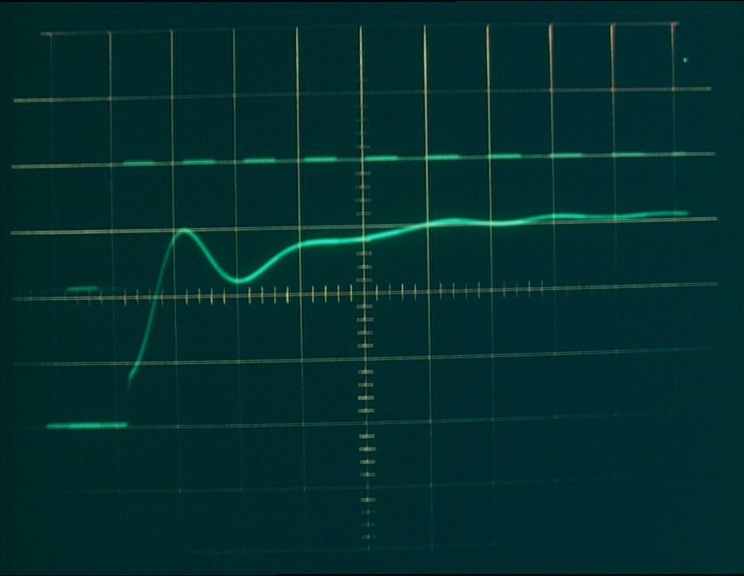
The main mesh framework is a large grid of wires that represent finite-difference models. Grids like Ishiguro’s are used as the basis of most modern computer-based storm surge modelling, allowing oceanographers to control calculations in distinct sections of a body of water, with the grid-like structure helping formalise the otherwise amorphous variables under examination (see Figures 9 & 10). In Ishiguro’s machine hydrodynamic equations are applied to each mesh, which are then solved simultaneously within a specified time framework in order to create differential equations within appropriate conditions (Ishiguro, 1968). Once the parameters have been set, electrical waves are run through the mesh of wiring that can be altered to represent different strengths of surge and different wave formations (see Figure 11). The results can be recorded by oscilloscope or photographic imprint along with the difference number from the mesh to provide wave responses of the modelled event.
This method allowed Ishiguro to track the hydrographic movement, as electronic quantities, across small sections of water in order to build a simulated model of a surge in its entirety. As a consequence, he was able to make predictions about which areas of coastline along the North Sea basin would incur a violent impact in the event of a storm surge, or whether the surge would avoid the coastline altogether. Subsequently areas could be highlighted as particularly vulnerable in order to recommend increased flood barriers or locations recommended for the installation of tidal gauges for improved sea level measurement. Ishiguro’s research also had implications on construction in the North Sea. Throughout the 1970s and 1980s much of the NIO’s work was directly funded by the oil company Exxon (Woodworth, 2012). Drilling for oil and gas began in 1964 and, alongside the Meteorological Office, the National Institute’s work was employed in order to provide accurate forecast conditions for the installation and maintenance of rigs in the North Sea (Walker, 2012, p 371).
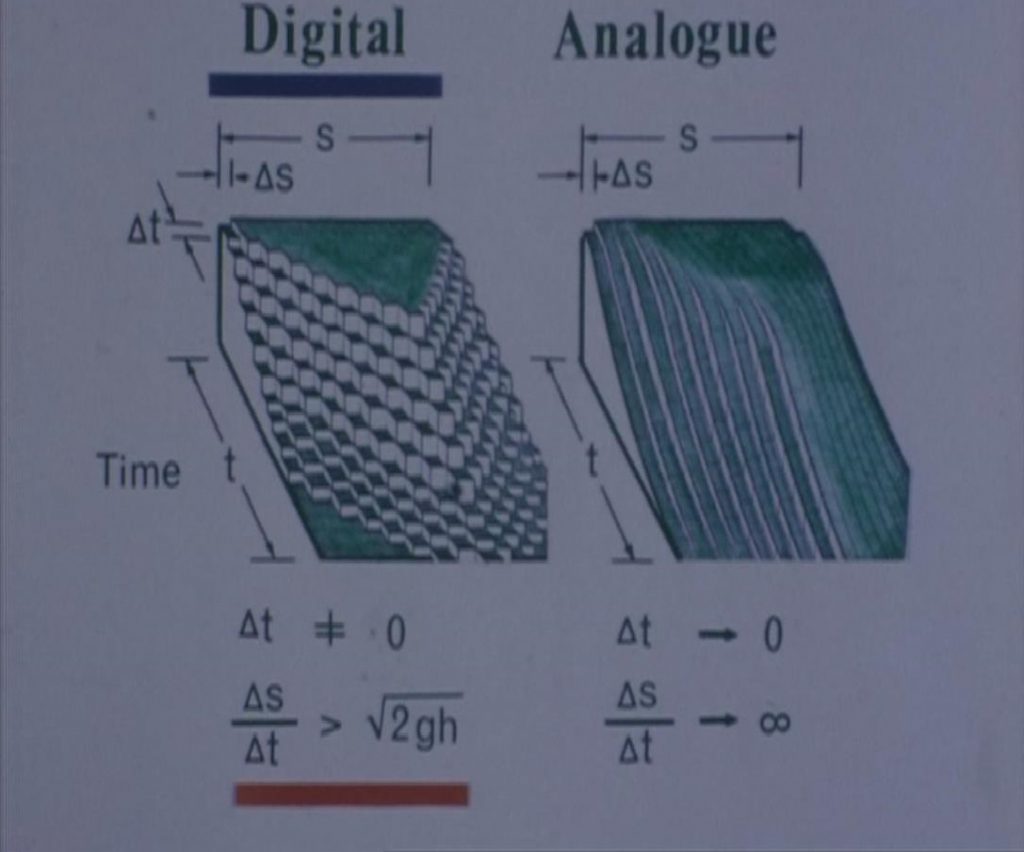
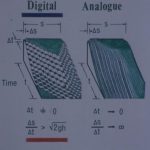
Ishiguro proposed that his electronic machine had advantages over contemporary digital machines as it offered continuous variation of current in contrast to the finite increments of digital machines of the period (Ishiguro, 1968) (see Figure 12). Its use of electronics offered an approach to the physical modelling of water that answered problems not met by digital equivalents of the time and allowed for more flexibility when simulating due to its ability to be tweaked by the researchers in real time. However, while considered to have been an innovative development in oceanographic instrumentation and analysis, the machine’s construction came at a time when computer models were fast developing and during its development it was eclipsed by digital flexibility beyond the capacity of Ishiguro’s machine (Laughton, 2010, p 176). However, it remains a key example of electronics and analogue modelling techniques in this field, representing both a specific period of oceanographic research (1950s and 1960s) and an alternative method to the digital models in their infancy.
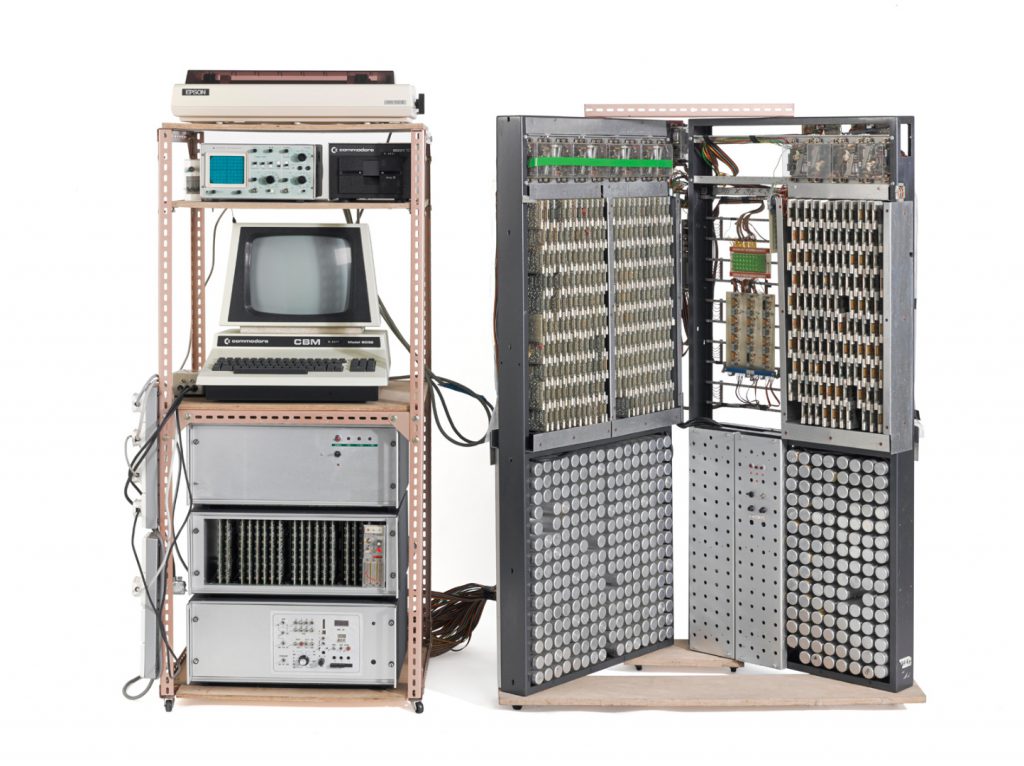
Following the technological changes across the NIO, Ishiguro’s machine was thought to have been destroyed, with no trace remaining bar a film in the NOC archive (Woodworth, 2015).[6] In fact, the machine was still intact in the Ishiguro family home, in the small shed where Shizuo had continued to work on it. The machine was developed continuously over a period of around fifty years, at the NIO between 1960 and 1983, and later outside of the organisation through Ishiguro’s continued work on the machine at home up until his death in 2007.[7] The Science Museum has acquired the machine in its final formation, comprised of two main units; one holds the input and output devices (wave-form generator, Commodore CBM 8032 Computer and Commodore 2031 5¼” floppy disk drive, OS-240 oscilloscope) and the other comprised of the mesh grid through which the electricity ran, and the photographic recording components of the device are housed.[8]
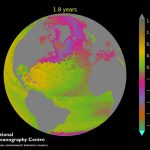
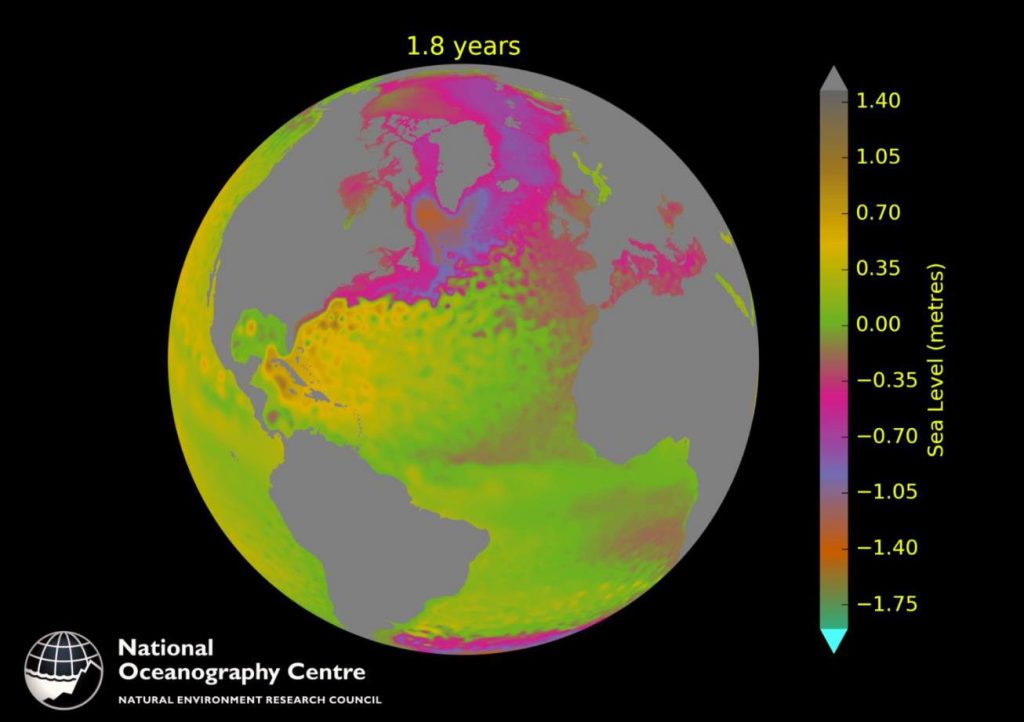
Alongside Ishiguro’s machine, Mathematics: The Winton Gallery will present modern forms of oceanographic modelling and data collection techniques used at the NOC and other oceanographic industries today. Institutions like H R Wallingford, Europe’s largest independent research consultancy, continue the tradition of physical modelling in combination with computer systems and theoretical mathematics in their large-scale models of coastal structures. The NOC now relies heavily on mathematical software, using programmes like Python or CS3x to model sea level and surges, whilst continuing to rely on the measurements from tidal gauges but with the application of technologies like radar to collect more precise data (see Figures 10 & 13).
The NOC is currently owned by the National Environment Research Council with much of its funding coming from the Environment Agency, representing a shift in recent years to concerns about global warming and climate change. Alongside preventive forecasting, their work now informs the installation of wind farms. Mathematically their models and simulations are ever more complex as a result of the deeper understanding of weather systems and larger collection of data. Newer mathematical techniques are now used, such as ensemble forecasting which builds on multiple simulations of an ocean event in order to develop a probability for a forecast’s reliability rather than to define a singular model from which to forecast the outcome of a surge. Future storm surge models will continue to develop finer meshes of computation and better bathymetric modelling, along with the ability to input real-time data from sophisticated gauge technology (Smith and Ward, p 286).
Ishiguro’s machine and these current oceanographic models are mathematical attempts to understand and control natural phenomena. The storm surge modelling machine, while the work of an oceanographer and engineer, relies on mathematics at its heart. It is mathematics in relation to fundamental human concerns, developed in response to real world problems that affect cultures across the globe. The devastating floods of 1953 were a historically significant event in British history, as was the development of the North Sea oil industry. From a technical standpoint, this machine represents a unique example of electronic analogue computation for hydrography and storm surge analysis, before the development of complex computer modelling took hold in oceanographic research (Cartwright, 2011). Through the application to physical elements the machine offers an intriguing and visually stimulating way to introduce complex mathematics. By attaching the subject to objects, people, technology and events, as we have in the case of the storm surge modelling machine, we hope that Mathematics: The Winton Gallery will show mathematics to be both inspiring and relevant.
Acknowledgments
With thanks to the Ishiguro family for their generosity in donating the machine to the Science Museum, and in particular to Fumiko for answering my requests for information about her father’s work. I would also like to thank Phillip Woodworth, Liz Bradshaw and Chris Wilson at the National Oceanography Centre and BODC for offering an insight into modern day oceanography.
Tags
Footnotes
Back to text
Back to text
Back to text
Back to text
Back to text
Back to text
Back to text
Back to text
References
Author

Media in article